Quick Reports Overview
One of the most important tasks in data management is quick reports generation. The SapphireOne Quick Report editor is one of several custom report tools available within SapphireOne for the designing of reports, allowing users to create a myriad of different reports from all available data tables and fields from within SapphireOne.
Using the Quick Report editor, you can build the specific reports you require for your business: Produce lists of records, create break areas, produce cross-table reports, compute summary calculations, modify fonts and styles in the report, define background colours on a cell basis.
In regards to design capabilities, Sapphire Quick Report Editor provides pixel-perfect layouts that allow for the creation of consistent report layouts that adhere to your company or organisations existing branding/style or guide requirements.
SapphireOne Quick Reports Editor Tool Bar
The Quick Report Editor Tool bar provides access to the main functions for managing reports

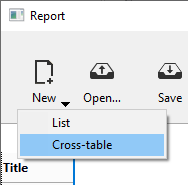
- New… – Creates a new blank quick report design. This button allows you to select the report type: list or cross-table (see below).
- Open… – Manages quick report files.
- Destination – Used to designate the output type for the report.
- Preview – Uses the preview system of your OS to display a print preview of the report.
- Execute – Generates report with the current data in the destination format defined.
- Clear – Erases all columns and rows of the report design template so that you can start over with a blank window. This button displays a confirmation dialog box.
- Revert – Replaces the current report design with the last version saved to disk. This button is disabled when the design displayed has not been saved in a file on disk.
- Header and Footer – Used to set the header and footer areas of quick reports.
- Options – Displays the report options window. The options displayed depend on the current output destination of the report.
- Fields – Displays a window listing all the fields of the current table and any related tables on one side, along with all the columns of the report on the other side. You can easily add, move or delete fields in the report.
- Hide bar – You use the vertical arrow button to hide or display the tool bar.
Dictation and Speech to Text Overview
SapphireOne’s implementation of both Dictation (MacOS) and Speech to Text (Windows) is a game changer for data entry. Any data entry field you can type into using a keyboard can use this feature.
You can also use this functionality on all inquiry screens within SapphireOne. For example, the user is in a Contact within a Client. They may have made a phone call to that particular client using the Softphone technology. Consequently, this will automatically date and time stamp both the contact and the phone number you called.
As soon as the call is completed, the user has the ability to use Speech to Text (Windows) or Dictation (MacOS). They can dictate into the memo field of the CRM contact, adding as much description as they require.
Dictation and Speech to Text Procedure
This functionality applies across every single Data Entry screen. For example, the SapphireOne user is entering a Vendor Invoice (VI). Additionally, you may want to add a memo within the Vendor Invoice (VI). The user can utilise the tool and simply dictate the memo.
Another example is if the user wants to add additional lines to the General Ledger account, within each General Ledger account. When the user is completing data entry using a General Ledger, there’s always a unique memo field for each GL account line.
The user can then utilise this feature to quickly add the information they need to add. Alternatively, you may have an interview with an employee. After the interview process is completed, the user can then make notes about the employee.
Speech to Text or Dictation is an extremely powerful tool. It is something that we at SapphireOne, as well as our clients, utilise daily. It is a massive time saver.
Quick Reports Design and Preview Area
The Report Design and Preview area allows the user to build report design templates and insert fields using the ‘+‘ button or the pop-up window; you can also adjust the width of columns, add or remove subtotals and formulas, set cell background or text colours, and more.
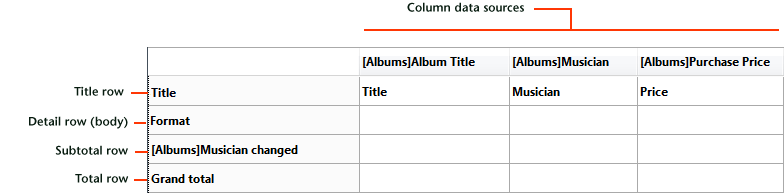
The following diagram illustrates the relationship between the specifications in the design itself and the printed output.
List Mode and Cross-Table Mode
In the Quick Report Editor there are two operation modes available that generate two specific types of reports, List mode and Cross-Table mode.
List Mode
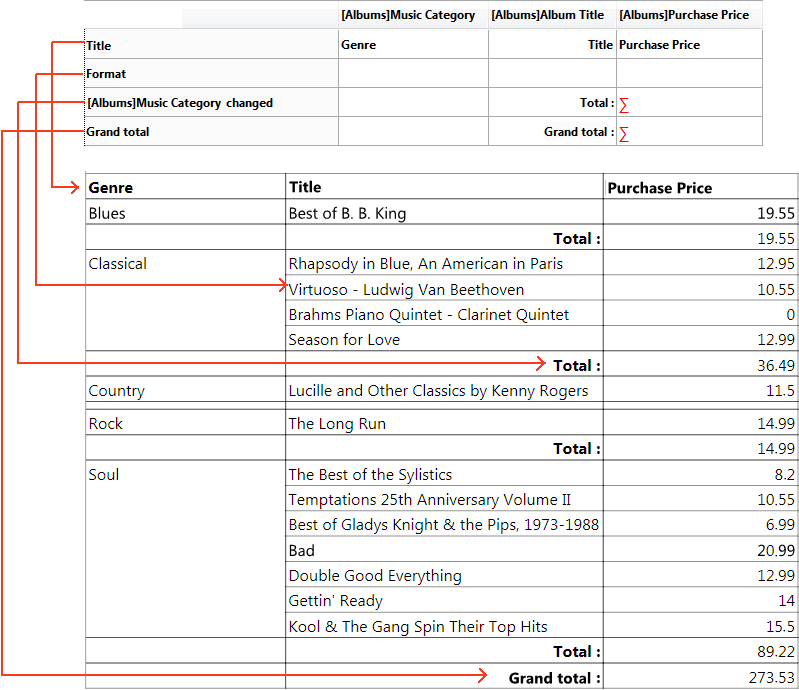
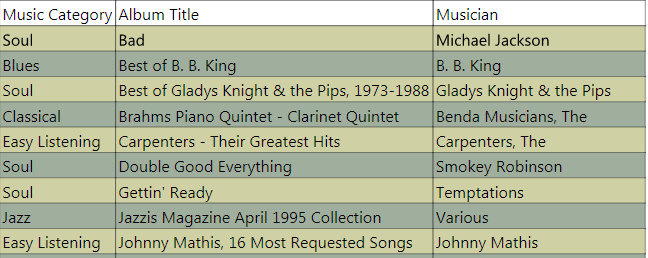
List Mode is the default mode of the SapphireOne Quick Report Editor. In this mode, reports typically display records as a list with break levels where sums are performed. The following is a typical List type quick report.

Cross-Table Mode
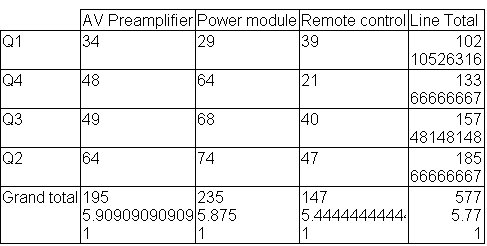
Cross-Table Mode allows you to display your report as a two-dimensional table. This is useful when you want to display data from one data source broken down into categories that are actually a function of two other data sources. For example, a cross-table form would let you display, in a table, how many of each product type was sold in each quarter. The following is a typical Cross-table type quick report.
How to Create a Quick Report
The SapphireOne Quick Report Editor allows you create reports in the Design or Application environments. You can open the Report Editor in its own window, or insert it into a form area.
Create a Quick Report in the Editor
To design and create a Quick Report in the Editor, simply:
- Select Quick Report… from the Tools menu or click on the Tools > Quick Report icon in the SapphireOne toolbar. SapphireOne displays the Quick Report editor in List mode, by default. If a previous report has been defined, it appears in the editor window. To clear the contents of the window, click on Clear or New… in the standard toolbar of the editor.
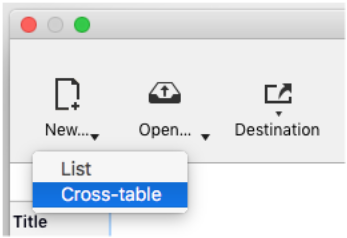
- If you want to create a cross-table report, select New > Cross-Table in the standard toolbar.
- Begin defining the contents of your report.
Create a Quick Report in a Form
To create a Quick Report in a form, simply:
- Add a subform area and assign the following properties to it.
- “Output Subform”: option deselected
- “Detail Form”: select SapphireOne subform %report (SapphireOne Report)
- “Variable or Expression”: reference of the area (to be passed to commands of the Quick Report theme)
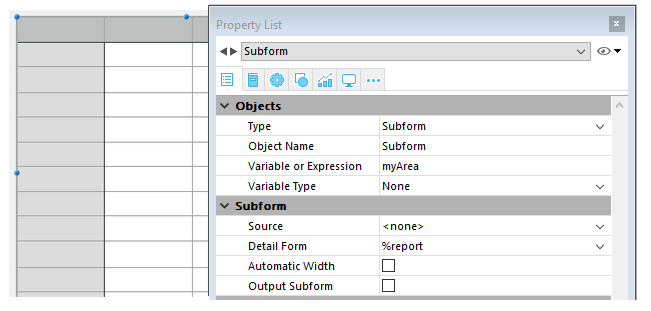
- In the form method, initialise the field with a code of the type:
 If(Form event code=On Load)
    C_LONGINT(myArea)
    QR NEW AREA(->myArea) //initializes a new report area
    QR SET REPORT TABLE(myArea;1) //pass the number of the report table
End if - Start defining the contents of the report using the context menu or via the language commands.
How to Load and Save in Quick Reports
You can save a Quick Report design as a file that you can open from the Quick Report editor. The Quick Report design includes all of your specifications for the report, but not the data. By saving report designs, you can maintain a library of quick report designs that you can use according to your needs. When the Quick Report editor is open, you can load a saved design and use it to print a new report. You can use the same Quick Report design repeatedly to print different selections of records.
To save a Quick Report design, click on the Save or Save as… button in the toolbar area.
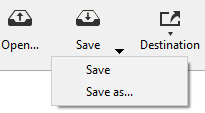
- The Save button directly saves the quick report design in its associated file on disk (except when it is clicked for the first time, in which case it has the same effect as the Save as… button)
- The Save as… button displays a standard save file dialog box in which you can name the quick report design file. The saved file then becomes the new file associated to the report design.
- Enter a filename for the quick report and click Save. SapphireOne saves the report as a file that you can open again with the Quick Report editor. If you modify the parameters of the report subsequently, they will be automatically saved in the report file when you click on the Save button.
It you close the Quick Report editor or click on the New… or Open button in the tool bar of the editor while the current report design has not yet been saved, the following window appears.
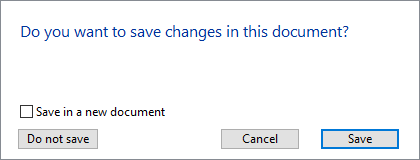
Check the Save in a new document option if you want to create a new file for the edited quick report design.
Note: If you close the editor without saving your report, it remains stored in the current memory until the database is exited. This means that it will still be displayed if the editor is opened again.
To load a report design saved on disk:
- Click Open… in the tool bar of the editor. SapphireOne will display an open file dialog box with a list of available quick report designs.
- Double-click a file name or select a file name from the list and click Open. SapphireOne will replace the current design with the design you opened.
Adding Columns and Labels
The user can create a List Report by adding columns containing field references or formulas, and a Cross-Table Report by adding field references or formulas in the data cells.
For both types of reports, the user can add and organise field references in two ways:
- Directly in the Quick Report preview area.
- Using a fields list window, named ‘field picker’.
Principles of Use for Database Fields
- When you work in Design mode, the Quick Report editor considers all database relations as automatic, and thus allows access to all the related data of the database. In Application mode, when the editor is called using the QR REPORT command, non-automatic relations are not automatically enabled and it is up to the developer to manage the status of the relations.
- Invisible tables and fields do not appear in the lists of fields of the Quick Report editor.
Defining a Report in the Preview Area (List Reports)
You can work with columns directly in the report template or using the field picker window.
Adding or Inserting Columns in Quick Reports
You can add, insert or duplicate columns in the report design template. When you add a column, the editor automatically uses the next “available” field of the current table, in the order of creation.
You can use the ‘+‘ icon that is shown at the top of each column separator.

- Clicking directly on the icon adds a new column at the end of the report.
- A right-click on this icon displays a pop-up window where you can either choose to add all fields of the current table, or add a formula.
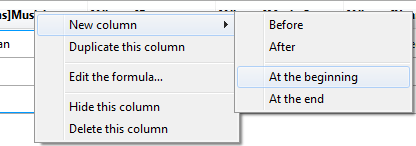
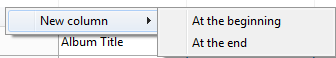
Each column of the report has a pop-up window that you can use to insert another column: either before or after the existing one, or at the beginning or end of the report. A pop-up window is also available at the top left corner of the report design template.
The user can also duplicate a column using the pop-up window available when you right-click on its header. Select the Duplicate this column command and an identical column is added to the right of the original one.
The user can move a column at any time by clicking on its header and dragging it to a new location.
Deleting Columns in Quick Reports
As you specify fields for your quick report, you may want to remove certain columns. To delete a column, right-click on its header, then select the Delete this column command from the pop-up window.
Replacing Columns in Quick Reports
You can replace a field with a formula and vice versa.
- Double-click on the column header, or right-click on it and choose Edit the formula… in the pop-up window.
The standard Formula editor of SapphireOne appears, allowing you to designate the new data source of the column (field or formula). - When you print the quick report, SapphireOne prints the results of the formula for each record that appears in the Format row.
Defining a Report Using the Field Picker (List Reports)
The user can click on the Fields button in order to access the available fields window, where you can organise the columns of the editor displayed in the form of a list.

The window has two adjacent lists:
- Available Fields – Includes all the fields of the current table as well as fields of any related tables.
- Report Columns – Lists the columns currently included in the report.
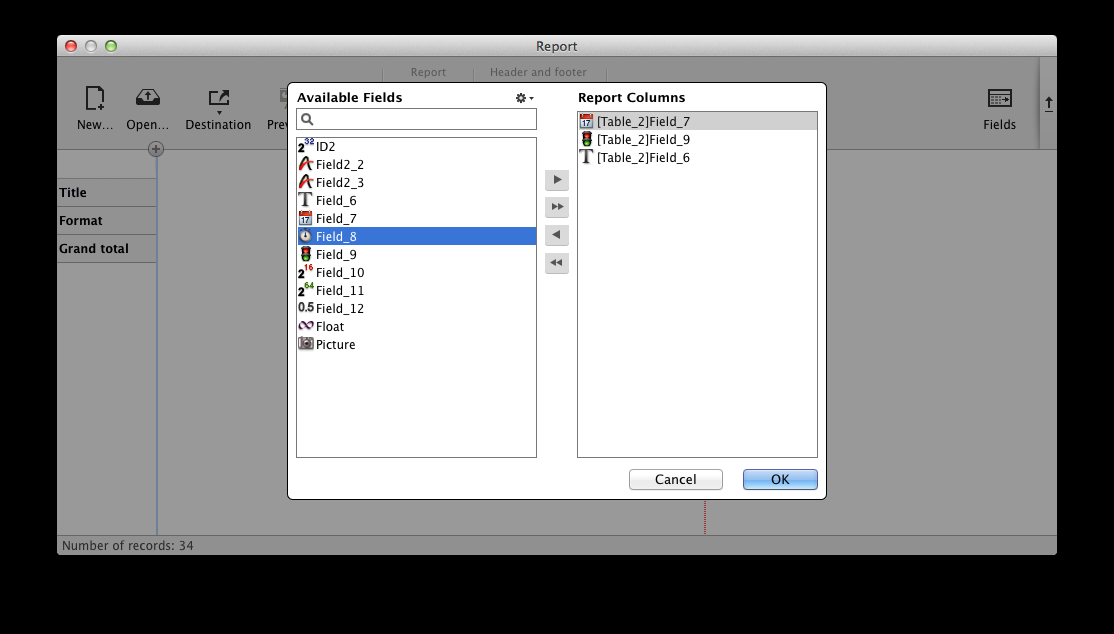
You can add and remove fields in the Report Columns list using the arrow buttons found between the lists, and you can change the order of the fields by dragging them up or down directly in this list. You can also add fields by simply double-clicking them in the Available Fields list.
When you click OK, all the changes made are automatically mirrored in the report itself. For example, if you remove or add a field in the Report Columns list, the corresponding column is also removed or added in the report itself; the same goes for any changes made in the field/column order.
Note: The search area performs a “contains” type search; i.e., it displays all fields whose name contains the letter(s) entered.
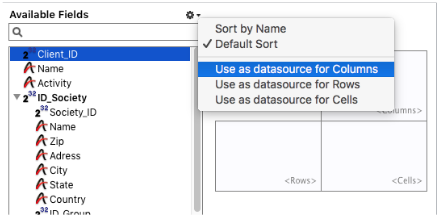
You can use the action menu  to sort the Available Fields list, or quickly add multiple fields from this list to the Report Columns list.
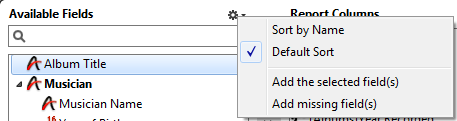
- Sort by Name – sorts fields alphabetically.
- Default Sort – sorts fields based on order of creation.
- Add the selected field(s) – adds fields to Report Columns list, in the same order they are selected.
- Add missing field(s) – adds all fields (not already included) to Report Columns list.
Adding or Modifying Values in Data Cells (Cross-Table Reports)
You can add or modify values in the different data cells (“Columns”, “Rows” and “Cells”) either by using the field picker dialog box, or by double-clicking on each data cell separately.
Using the Quick Reports Field Picker Dialog Box
To assign fields to data cells, click on the Fields button in the tool bar of the Quick report editor.
The field picker dialog box is displayed below:
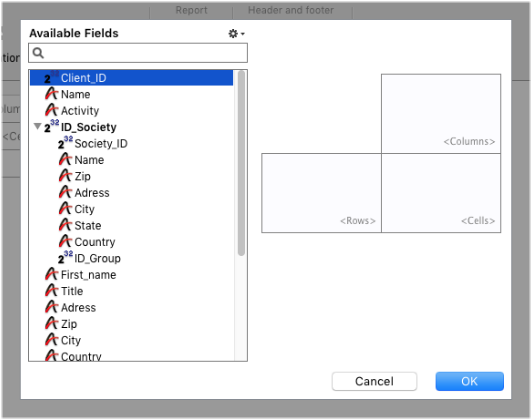
The user has three ways to add or organize fields in the data cells.
- Double-click on an item in the Available Fields list to assign it to the first empty data cell (order is columns, rows, cells).
- Drag an item in the Available Fields list and drop it in a data cell in the right-hand part.
- Select an item in the Available Fields list and assign it to a data cell by choosing the corresponding command in the action menu:
Using the Quick Reports Formula Editor
You can assign a formula to a data cell (or edit the existing one) by double-clicking the cell area to display the Formula editor. You can then select a field, or write a formula for the cell.
The Formula editor is also available using the Edit the formula… command in the context menu of a data cell.
Associating Formulas With Quick Reports
You can add Quick Report columns whose contents are calculated automatically by formulas when the report is generated. For example, you can add a formula that computes employees’ monthly salaries from an Annual Salary field.
To add a formula type column:
- Add or insert a new column (see above).
- Double-click on the column header or right-click on it and choose Edit the formula… in the pop-up window.
SapphireOne displays the Formula editor. The editor displays the current contents of the column. The formula you create will replace it. Note: Make sure that the formula you create does not change the current selection. Changing the current selection will cause problems when you print the quick report since the report is based on the current selection. - Build the formula by selecting fields, operators, SapphireOne commands and/or methods, then enter the desired values in the editing area. Alternatively, click the Load… button to retrieve an existing formula from disk. To save the formula as a file that you can retrieve and use in another column or in another report, click the Save… button and enter a file name in the dialog box.
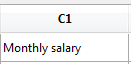
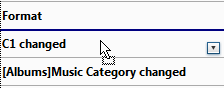
- Click OK to assign the formula to the column. SapphireOne adds a new label to the column that identifies it as a formula. You can rename the column by typing a label into the header cell for that column. The formulas are labelled C1 to Cx. These labels are the name of the variables containing the current value of the column. You can use these variables in other formulas.
Note: The Cx variables for quick reports must be typed in case of database compilation.
Sizing Columns
By default, the Quick Report editor sizes columns automatically, as reflected in the Automatic Width button. It sizes each column based on the maximum length of data displayed in the column as well as any labels typed into the column. The Quick Report editor sizes the columns when the report is printed.
This operation is enabled for a column when the Automatic Width attribute has been associated with it. You can set and view the activation of this option in the pop-up window associated with the column.
To view the widths of each column, preview the report on screen by clicking on the Preview button.
Because selecting the Automatic Width option changes the column width based on the maximum width of the data in the records being printed, selecting different records can change the column size.
You can resize a column manually, which automatically causes the Automatic Width option to be deselected (where applicable). When a column size is set manually, the column text wraps within the specified area.
Adding and Modifying Text in Quick Reports
You can add or modify text in the quick report form to label parts of the report. For example, if you requested summary calculations, you can label them by adding text to other cells in the Subtotal and Grand total rows. You can add and modify text as follows.
- Edit the text that SapphireOne automatically adds to the Title row of the report.
- Insert text in empty cells of the Subtotal and Totals rows.
- Insert the value of a Subtotal field in the Subtotal rows,
- Specify the font, font size, justification, and style for any text that appears in the report.
To add text, double-click on an empty cell in the quick report form. A text insertion point appears in the cell, so that you can enter your label.
Note: A local menu also appears so that you can add a calculation.
If you are entering a label for a summary calculation, select a cell in the same row as the cell containing the calculation icons. You cannot enter text in the same cell that contains summary calculations.
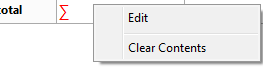
To modify text, double-click in a cell to switch to editing mode. You can also right-click in order to display a pop-up window allowing you to edit or clear the cell contents.
Graphic Attributes of Quick Reports
SapphireOne Quick Reports Editor allows the user to modify the graphic appearance of all Quick Reports. The user has the ability to set the following attributes:
- The character font, as well as its size, justification, style and colour,
- The background colour of the cells, as well as an alternate background colour.
- The cell borders.
Specifying Character Font, Size, Justification, Style, and Color Attributes
While designing your Quick Report, you can specify different fonts, font sizes, justification, styles, font colours and background colours. You can then apply these specifications to text, data, and summary calculations within rows, columns, or cells in the quick report.
To specify a character font, font size, style, justification or colour:
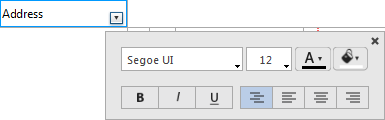
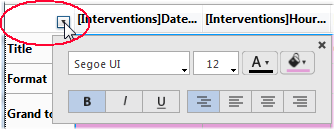
- Place the mouse over the bottom right of the element you want to configure in order to display the button for calling the pop-up window; then click on it:
Note: The pop-up window can display additional options in its lower part based on the element being configured.
- In the upper part of the window, choose the graphic property to be defined:
- font
- font size
- font color
- background colour
- style
- justification of contents.
SapphireOne applies the parameters to the text, data or calculations included in the selected area. You can define parameters for all report areas by selecting the pop-up button in the top left cell of the report design.
Note: Justification parameters are not previewed in the report area, but are applied in generated reports.
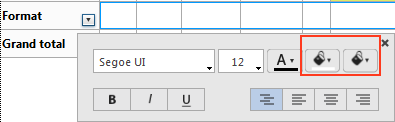
Specifying an Alternating Background Color
The Quick Report editor allows you to set an alternating background color for the report, which provides better readability for tables.
To set an alternating background color, display the pop-up window of the Format row and specify two colors to be used by means of the two background color menus.
Here is an example of a generated report (preview) that has alternating background colors.
Background colors are also taken into account in reports generated in HTML format.
Setting Borders in Quick Reports
You can set the borders for cells in both cross-table and list reports. To set the borders for a cell, a column or a row:
- Place the mouse over the element you want to configure in order to display the button for calling the pop-up window, then click on it:
- In the border area, choose appropriate parameters:
- Select the border configuration to set:

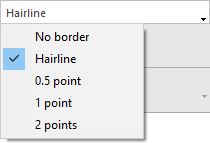
- Select the line thickness:
- Select the line colour.
- Select the border configuration to set:
- Click the Add button to apply the border configuration to the selected element.
Each time you click the Add button, the current border configuration is added to previous configurations for the selected element (if any). The final result can only be seen when you generate the report. To remove all border configurations from the selected element, click the Clear button.
Sorting Records and Adding Breaks in Quick Reports
An important feature of the SapphireOne Quick Report Editor is the ability to sort the records in your report. You sort records for two reasons:
- To view records in a particular order.
- To create groups of records and subtotal areas in the report for the purpose of reporting summary calculations for groups.
Specifying a Sort Order for a List Report in Quick Reports
The user can specify a sort order at any time using the pop-up window associated with the column header. You choose a sort order (ascending or descending) using the Sort Order menu of this window.
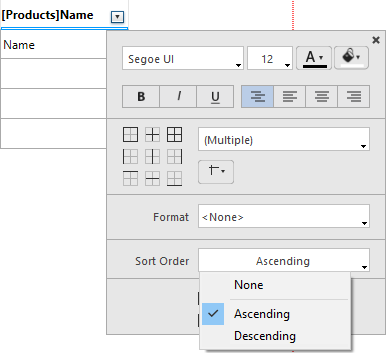
This works for columns containing fields or formulas.
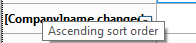
Once a sort is defined, a break row is added to the quick report. You can see the sort order at any moment by hovering over the break row header.
Changing the Sort Level in Quick Reports
The user can sort a report on several levels. Sort levels are displayed in order as break rows (subtotals) in the report design area. To change the level of a sort, you can drag and drop the break rows to move them up or down within the report design area.
Deleting a Sort or a Break Row in Quick Reports
The user can delete any break level along with the associated sort of the column either by.
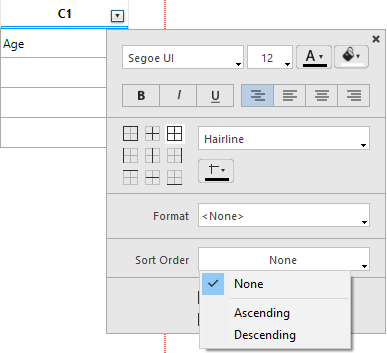
- Choosing None in the “Sort Order” menu of the pop-up window for the associated column, or
- Selecting Remove this break row in the pop-up window for the row.
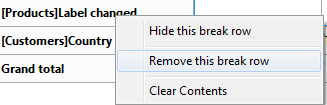
The break level is then removed. Note that in both cases, the column is no longer sorted. If you want to sort a column without adding a corresponding break level, you can simply hide the break row using the pop-up window.
Sorting Cross-Table Values
In a Cross-table report, the only values that can be sorted are the horizontal and vertical data sources (the two data sources that are used as categories in the final table).
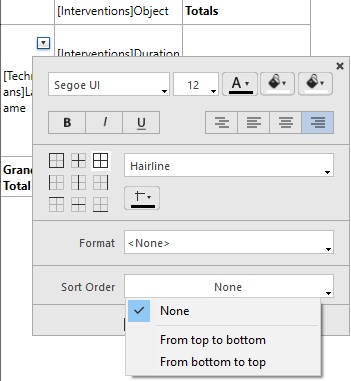
To sort the categories in a cross-table report, open the contextual window related to the category and select a value in the Sort Order menu of the pop-up window:
- Select From left to right or From right to left to sort the horizontal data source.
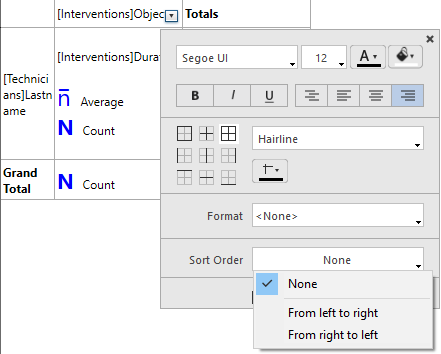
- Select From top to bottom or From bottom to top to sort the vertical data source.
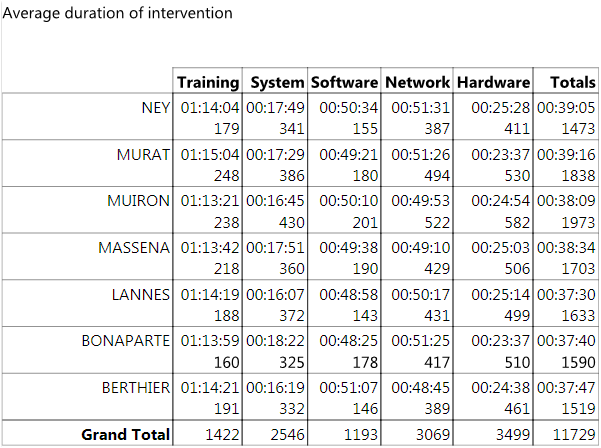
For example, the following cross-table report was sorted from right to left and from bottom to top.
Subtotal Levels
In a SapphireOne Quick Report, you set break levels to separate or “break” records into groups according to values in one or more sort fields. A break area is printed at each break level. You can print summary calculations in the break area. The summary calculations — sum, average, minimum, maximum, count and standard deviation — are calculated for each group of records.
Break levels are determined by the sort levels and Break rows. For example, if you sort records by Sales Region, SapphireOne inserts a break between each group of records that have the same sales region. These rows are automatically inserted when a sort is defined.
After you add a subtotal row to the quick report, you can request summary calculations on each break. For example, you can insert a summary calculation in a subtotal row to display subtotals for sales from each state in a marketing region.
The label of a subtotal row indicates which change in value triggers the break.
Using the Values of Break Fields in Labels
You can improve the appearance and clarity of your reports by labeling each Subtotal row using the value of the Break field.
To request that the value of a Break field be printed in a label placed in the Break area, use the number sign (#) in the label. For example, the text “Total salaries for # department” will insert the department name (in this case, the value of the Department field) in place of the number sign when the report is printed.
The number sign does not need to be placed in the same column as the Break field. It will display the value of the Break field in any cell in the Subtotal row.
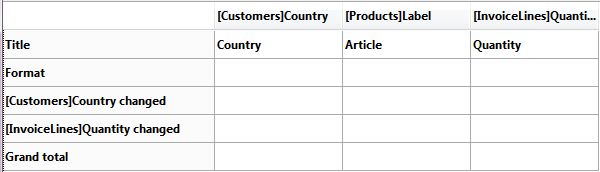
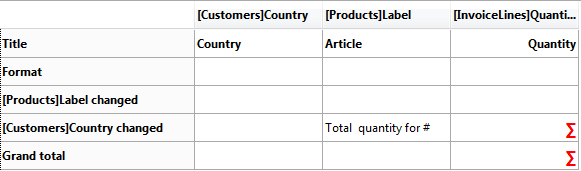
The following figure illustrates the use of the number sign in a label in the Subtotal row.
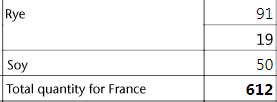
In the report generated, the following break row will be added to each country group.
Subtotal Spacing
The user can configure subtotal rows in order to control the page layout and appearance of the quick report. For example, you can generate a page break after each subtotal. The subtotal page layout options can be used to visually set apart the different parts of the report.
To set the spacing for a subtotal row, select a subtotal row and open its associated contextual window or (included area) contexual menu. You have the following options.
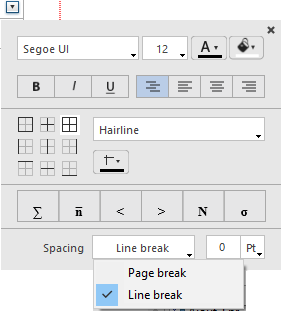
- Line break: A specific amount of space is added below each subtotal row in the report. An additional option is used to set the spacing mode.
- 0 pt or % (option selected by default) – No specific property is applied to the subtotal row; it has the same spacing characteristics as the other rows of the report.
- Extra pt – You set a specific height of extra space in points.
- Extra % of height – You set the amount of extra space to be added as a percentage of the standard row height of the report. For example, to generate extra space corresponding to two empty rows, pass the value 200.
- Page break: A page break is generated after each subtotal row in the report.
Adding Summary Calculations
You can add summary calculations on the contents of fields and formulas to total row, subtotal rows as well as (cross-table reports) to total column.
The summary calculation options available for quick reports are found in the pop-up window for a subtotal row or total row/column:
These calculations are also available in the menu that appears when you double-click a cell in a subtotal row or total row/column:
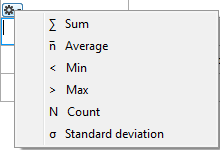
- Sum – Totals the values in the report or break.
- Average – Calculates the average of the values in the report or break.
- Minimum – Displays the lowest value in the report or break.
- Maximum – Displays the highest value in the report or break.
- Count – Calculates the number of records in the report or break.
- Standard deviation – Displays the square root of the variance of the report or break (the variance is a dispersion value around the average).
The Sum, Minimum, Maximum and Average calculations only work on a numeric field or formula.
- List Reports – When you place a summary calculation in the Total row, the calculation is done for all records in the report. If you place the summary calculation in a Subtotal row, separate calculations are done for the records in each break.
- Cross-table reports – Summary calculations will apply as follows.
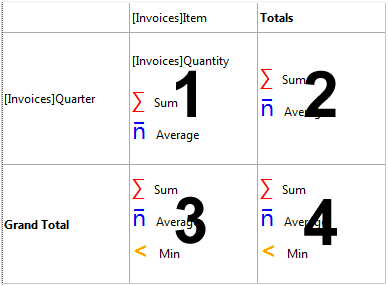
1 = Applies to each cell of the table
2 = Applies to values in each row
3 = Applies to values in each column
4 = Applies to values in both the last column and last row
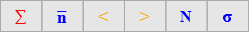
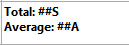
SapphireOne displays a calculation icon in the selected cell for each type of summary calculation you request (when no label is added). You can place several calculations in the same cell; they will be stacked in the report generated. The following figure shows the Sum, Average and Min icons in a Subtotal row:

Note that if you insert text labels in the cell, the calculations appear as codes (see below). If you add several calculations, you can format the cell, add commas, carriage returns, and so on.
Using Calculations and Column Values in Labels
The user can insert summary calculations using the following codes:
- ##S will be replaced by the sum in the Subtotal or Total row.
- ##A will be replaced by the average.
- ##C will be replaced by the count.
- ##X will be replaced by the max.
- ##N will be replaced by the min.
- ##D will be replaced by the standard deviation.
- ##xx, where xx is a column number. This will be replaced by that column’s value, using its formatting. If this column does not exist, then it will not be replaced.
These codes can be useful when you want to mix labels and data in a cell.
Displaying Repeated Values for Break Columns
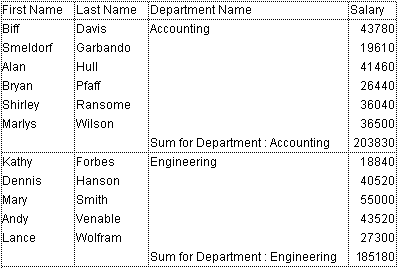
In a report with subtotals, the columns which are used to group records so that summary calculations can be done are called Break columns. In the report shown below, the Department field is a Break column since the records in the report are grouped by department.
When a report like this is printed, the values for the Break column are printed only once per break.
In other words, a department name is printed only for the first record in the group and is not repeated until the department changes.
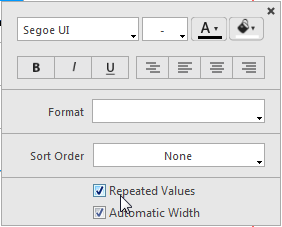
In some cases, you may want to repeat the values for the Break columns so that they appear for every record in the Break area. You do so by selecting the Repeated Values column property. This property is set in the pop-up window associated with the column header.
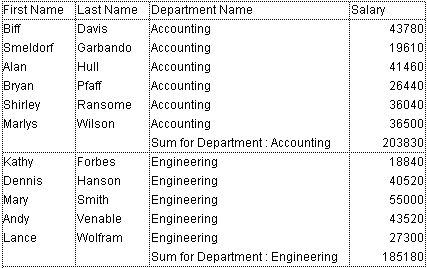
When the report is printed, break column values are repeated for each record.
The following figure shows the previous report after the Repeated Values check box has been checked for the Department Name column.
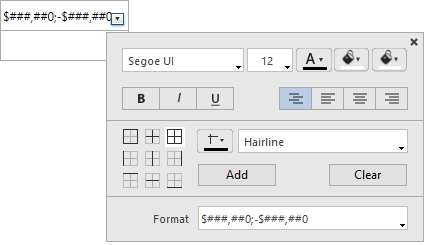
Setting Column Display Formats
You can specify display formats for columns that contain numeric, alphanumeric, date, time and picture data.
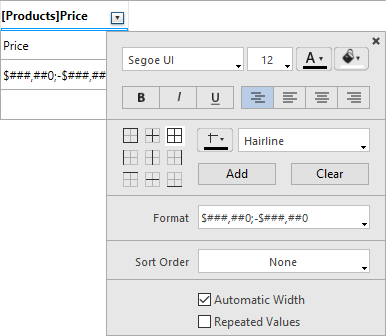
For example, if you are displaying prices in a column, you can add a numeric format to the Detail cell for the Price field. The $###,##0.00;-$###,##0.00 format places a dollar sign ($) to the left of the number and can display dollar amounts from -$999,999.99 to $999,999.99.
If your report includes Alpha fields, such as a telephone number or Social Security number, you can use an Alpha format. If your report displays dates, times or pictures, you can also assign display formats to them.
SapphireOne provides different default display formats. However, you can create your own display styles for numeric and alphanumeric formats.
To assign a display format to a numeric, alpha, date, time or picture field:
- Display the pop-up window associated with the cell where you want to associate a style.
You can use the header, in which case all the cells in the column will be formatted, or you can format each cell individually.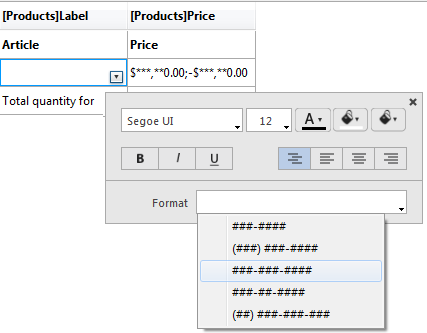
- Select the desired display format from the Format submenu.
The contents of the submenu vary according to the type of data contained in the column: numeric, alphanumeric, date, time or picture. If the report column contains data that cannot be formatted, the Format command does not appear in the pop-up window.
The format is entered in the cell of the Format row. If you have also requested summary calculations for the column, the format specified in the Format cell will automatically be applied to the summary calculations. The only exception is the “Count” calculation which is always displayed as an integer and does not accept any formatting symbols, such as a dollar sign.
You can also enter formats to be applied manually by clicking twice in the cell and entering the elements of the format using the keyboard.
Different formats can be applied to different columns in the report.
Hiding Rows or Columns
SapphireOne lets you hide rows or columns in a quick report in List mode. If desired, you can show a hidden column or row. Hiding rows is useful when you want the report to include only summary calculations. For example, hide the Detail row if you want to display only the summary calculations that appear in the Total and Subtotal rows. You can also use this feature to hide a Subtotal row or the Total row. You can hide a column if you need to use the column as a sort column, but do not want the report to display it.
You can hide/display a row or column using the Quick Report pop-up window.
To hide a row or column.
- Right-click on the header of the row or column to be hidden, then choose Hide this column (or Hide this row, or Hide this break row) in the pop-up window.
SapphireOne displays the column in gray to remind you that the row will not appear when you print or preview the quick report.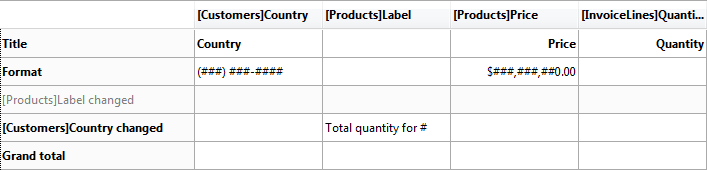
Showing a Hidden Row or Column
When a row or column is hidden, a check mark is displayed next to the Hide this column (or Hide this row, or Hide this break row) menu command in the pop-up window.
You can display a hidden row or column by choosing Hide this […] again from the pop-up window. When you do so, the row or column is displayed normally in the Quick Report area.
Adding Headers and Footers
You can add page headers and footers to your quick report. They are inserted when the report is executed.
The Quick Report editors allow you to do the following:
- Add page header and footer text or pictures,
- Specify the height of the page header and footer areas,
- Use separate text for left, center and right parts of the header and footer,
- Specify fonts, font sizes, and font styles for page header and footer text,
- Insert codes that add page numbers as well as the date and/or time to your reports.
You can only specify page headers and footers when printing to a printer. However, once they are defined, they are kept with the report, even if the destination is modified.
To add page headers and footers in a report design template, click on the Header or Footer button in the tool bar of the editor.
A definition area appears. This area works the same for headers or footers, only the label changes depending on which button you clicked.
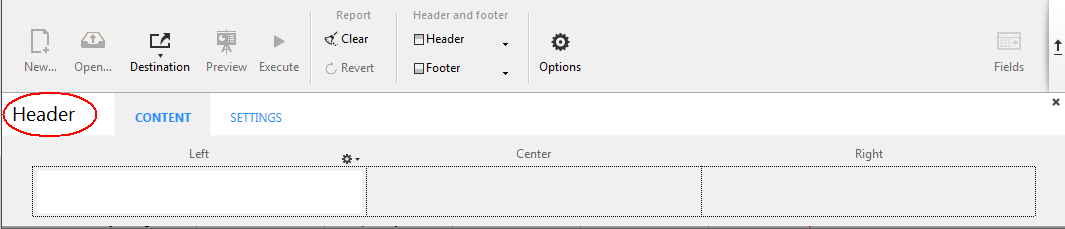
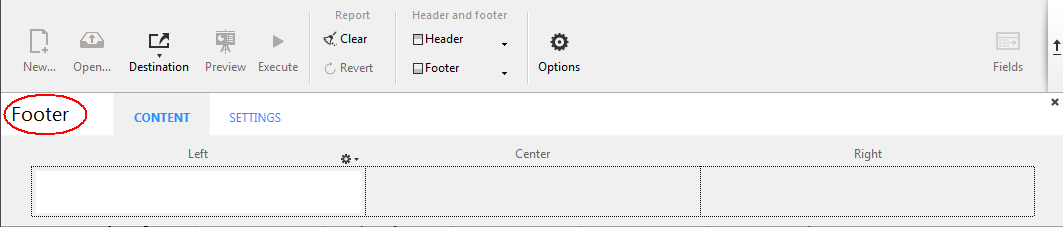
Defining the Content
You can use the Content page of the header and/or footer editor to define the content, both static and/or variable, to be displayed in each header and footer.
In the Left, Center and/or Right areas, you can enter information to be included in the report. You can insert the page number, as well as the date and/or time of execution in the header or footer of your report. There is a local menu above each entry area that you can use to insert variables.
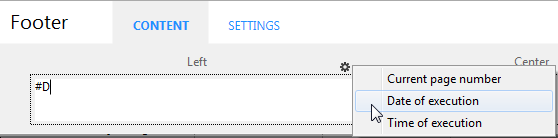
You can also enter the code of these variables directly in the area.
- #H to insert the time of execution,
- #D to insert the date,
- #P to insert the page number.
Defining the Settings
You can use the Settings page to configure the appearance of header and footer areas:
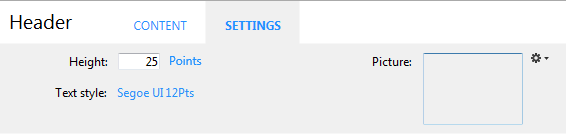
For each area, you can define.
- its height
- the font and text style
- a picture
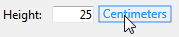
Height – Enter the desired height for the header or footer in the Height area as well as, optionally, the unit. By default, the header and footer size is set to 25 points. You can change this value as well as the unit used. Click on the unit in order to scroll through the available values:
Text style – You can modify the font using a menu linked to the “Text style” area. To choose a font style, size or color, choose the Show font… command at the bottom of this menu in order to display a font selection system dialog box.
Picture – You can use this area to set a picture as the header or footer.
To add a picture, you can:
- drag and drop a picture or a picture file onto the area.
- choose the Load… command in the local menu associated with the area.
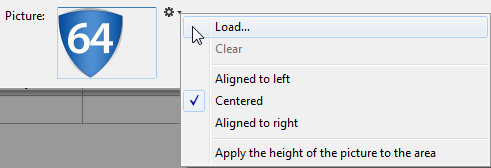
By default, the picture is pasted in the center of the header or footer area. However, you can modify its location (Aligned to left, Centered, or Aligned to right) using the local menu.
The Apply the height of the picture to the area option lets you automatically resize the height of the header or footer based on that of the picture inserted.
Executing a Quick Report
After you have completed your report design, you can “print” the quick report. You can print a quick report to a variety of output types.
- To disk, in a Text file,
- On the standard printer selected,
- To an HTML document.
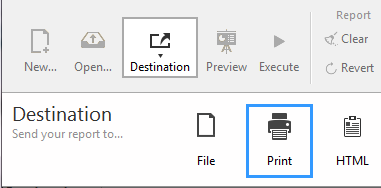
To select an output destination, click on the Destination button in the tool bar of the editor.

The destination selection window appears where you can choose one of the following: File, Print or HTML.
Notes
- The options available (Options button) depend on the current destination.
- You can also use the Preview button at any time (available only with the “Print” destination) in order to preview the execution of your report.

Disk File
This option saves your quick report to a disk file that you can open and modify with other applications, including text editors and spreadsheets. This option exports the records in the quick report to a text file.
When you select this destination, SapphireOne automatically uses the column headings as the first “record” that is exported.
When you click on the Execute button, a standard save file dialog box appears. If you have specified a name and location on the Options page (see below), they are proposed by default. Enter a file name and click OK. After the report is printed to a file, SapphireOne returns you to the Quick Report editor. Remember to change the output device if you want to send the quick report to a standard printer.
Note: This option does not benefit from the Preview function.
Text File Options
When the report destination is set to “File”, the following options are available.
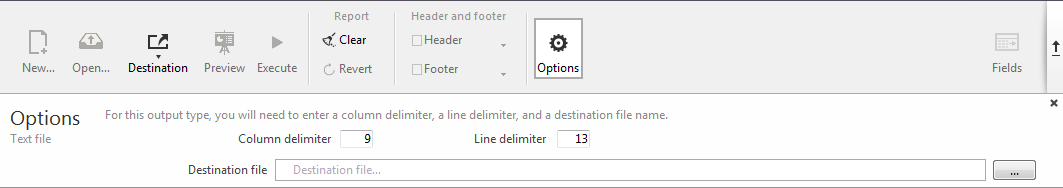
- Column delimiter and Line delimiter – These entry areas allow you to modify the character codes used by SapphireOne to delimit, respectively, the columns and lines in the text file generated.
By default, SapphireOne uses the character 9 (tab) for column delimiters and 13 (carriage return) for line delimiters. - Destination file – Used to set a name and destination for the file generated. The name and location entered will be proposed by default when the report is executed.
Once the location is set, you can preview it by clicking in the area.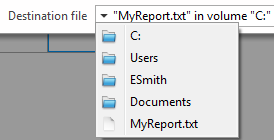
Note that this option does not generate an actual file; it just saves the path.
Printer
This option uses the printer you have chosen in your current print settings. If you are printing to a printer, you can preview the report before printing it.
When you click on the Execute button, SapphireOne displays the standard print preview dialog box of your OS. You can hide this dialog box by checking the Don’t display print setting option on the Options page (see below).
Print Options
When the report destination is set to “Print”, the following options are available.
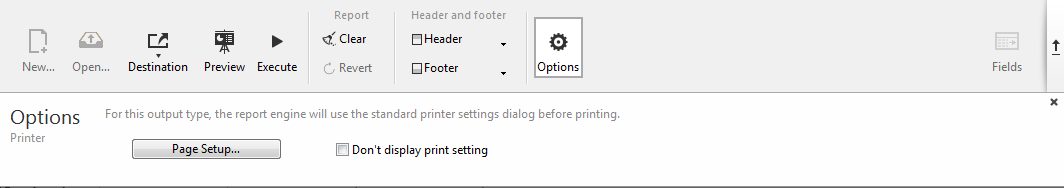
- Page Setup… – Displays the print settings dialog box of your OS, where you can set the paper size, orientation and print margins.
- Don’t display print setting – If this option is checked, when you click on the Execute button, the report is printed on the current printer without the print settings dialog box being displayed.
HTML File
This option sends your quick report to an HTML file. When you choose this option, it uses the default HTML template unless it was changed programmatically. You can also build your own templates and load them using the Options page (see below).
When you select this destination, SapphireOne automatically uses the column headings as the first “record” that is exported.
When you click on the Execute button, a standard save file dialog box appears. If a name and location are defined on the Options page (see below), they are proposed by default. Enter a file name and click OK. After the report is printed to an HTML file, SapphireOne returns you to the Quick Report editor. Remember to change the output device if you want to send the quick report to a standard printer.
The character set used for generating HTML code is specified using the “Standard Set” parameter of the Database settings.
HTML Options
When the report destination is set to “HTML”, the following options are available.
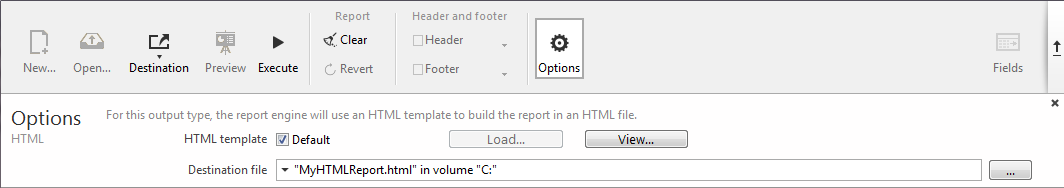
- HTML template – Sets the HTML template to use for generating the report. You can either:
- use the default template (Default option), or
- load a custom template by means of the Load… button. The View… button lets you view the code of the selected template in a separate window.
- Destination file – Used to set a name and destination for the HTML file generated. The name and location entered will be proposed by default when the report is executed.
Once the location is set, you can preview it in menu form by clicking in the area. Note that this option does not generate an actual file; it just saves the path.
You can review our Blog and YouTube channel for additional information and resources on SapphireOne ERP, CRM and Business Accounting software.