FX Chart of Accounts Report Overview
The SapphireOne FX Chart of Accounts provides a comprehensive list of financial foreign exchange accounts designed for recording transactions within an organisation’s General Ledger.
The FX Chart of Accounts essentially mirrors the SapphireOne Chart of Accounts function, differing only in its focus on reporting all foreign exchange financial accounts within the General Ledger.
Within the SapphireOne FX Chart of Accounts function, users can access a variety of valuable reporting options. These reports are selected by utilising the Report Type and Report Sort Order drop-down menus, as explained below.
FX Chart of Accounts Report Data Entry
When the FX Chart of Accounts option is selected from the General Ledger menu, a standard Printer dialog is displayed as seen below.
Print Destination Menu (FX Chart of Accounts Report)
Please note that when using this FX Chart of Accounts Report function, selecting either of the two options below will instruct your operating platform to send the report directly to the printer.
- Printer – Selecting the Printer option from the default Print Destination menu and subsequently clicking the print
 button, will instruct SapphireOne to send the report directly to the designated printer.
 - Custom Report – Alternatively, when the Custom Report option is chosen, SapphireOne immediately requests the location of an existing Custom Report to be used as a template when the print button is is activated. SapphireOne then generates the report, incorporating the selected Custom Report as the template.
- Quick Report – Selecting this option and then clicking the Print button will prompt SapphireOne to display the Quick Report screen, allowing the user to set up a quick report. For detailed instructions on setting up this report, please follow the link to the article on Quick Reports.
Report Types menu (FX Chart of Accounts)
The selection of Report Types through the drop-down menu item displays a Chart of Accounts report that provides the user with the desired information.
| Account ID | This prints a chart of accounts using the Standard Account ID. |
| UDF Fields | This prints a chart of accounts using the UDF Field. These details are entered General Ledger Inquiry on the More Details page in the User Defined area. |
| Alternate Codes | This prints a chart of accounts using the Alternative Code. These details are also entered in General Ledger Inquiry on the More Details page in the User Defined area. |
Report Sort Order menu (FX Chart of Accounts)
This option allows the user to sort the chosen report in the order required for printing. The report may be sorted by the following methods.
| No Sort | The Default option where no sorting is performed at all |
| Account | This prints using account names. |
| Account ID | This prints the chart using the standard account codes. |
| Alternate ID | This prints the chart using the Alternate ID (User Defined area). This area is on the More Details Page in a General Ledger Inquiry. |
| Class | This prints the chart using the Class ID as set in the first Page of a General Ledger Inquiry Details. |
| Department | This prints the chart using the Departments, as set in the first Page of a General Ledger Inquiry Details. |
Report Selection menu
From this menu the user has just the two options as follows:
- Active Only – Selecting this default option option will tell SapphireOne to print the report including all active general Ledger records within the data file.
- All Records – When this option is selected SapphireOne will process the report on all records, including General Ledger Accounts that are no longer active.
Report Selection options
In SapphireOne, consistency in layout is maintained across all print dialogue screens, ensuring users do not need to constantly adapt to varying layouts. However, it’s important to note that the Report Selection options documented above, do differ for almost every print dialogue screen.
For additional filtering of reports using criteria from cells within related tables, refer to the following details. Once users enter data into either the third and fourth data entry fields below, the Selected Records radio button will become active, indicating that additional filtering is being applied to the report. A screenshot of this area is provided below for reference with the radio button active, (visible).
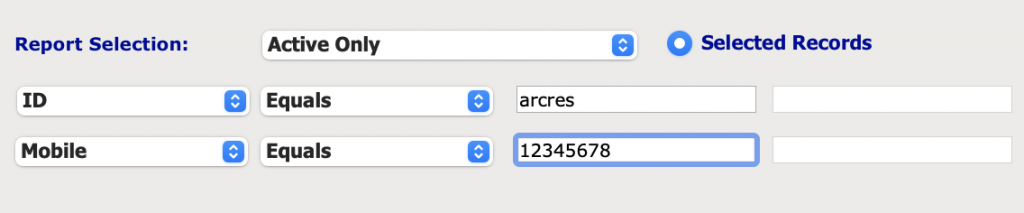
Directly beneath the Report Selection heading, you’ll find two rows, each containing four items, where you can establish additional selection criteria for your report. These rows consist of two drop-down menus and two data entry fields for user input.
In each row, the first drop-down menu allows users to select from various cells within related tables in the data file. These options in the first drop-down menu may or may not pertain to the same cells in the same table in the second row. To access the available options in these two drop-down menus, simply click on the respective item to display the drop-down menu and make your selections as required.
The second drop-down menu in both rows enables users to choose a mathematical option for each row. In this case, the available options are consistent and include: Equals, Not equal to, Less than, Greater than, Between, Contains, and Does not contain.
The last two columns in each row is where users input the data required for the mathematical calculations mentioned earlier. Typically, data is entered into the first data entry field. However, when selecting the Between option, data must be entered into both columns. This allows SapphireOne to filter the data based on the range defined by the user’s input in these two data entry fields.
Report Buttons
- Print – This print button will take the user to you operating platforms Print dialog screen.
- Cancel – This button will cancel the current procedure.
- Record List – When this button is selected SapphireOne will allow the user to view the current selection.
- Options – he Options Button Is not used for this chart of accounts report so the user will find that it is greyed out and so unusable. immediately below in this article.
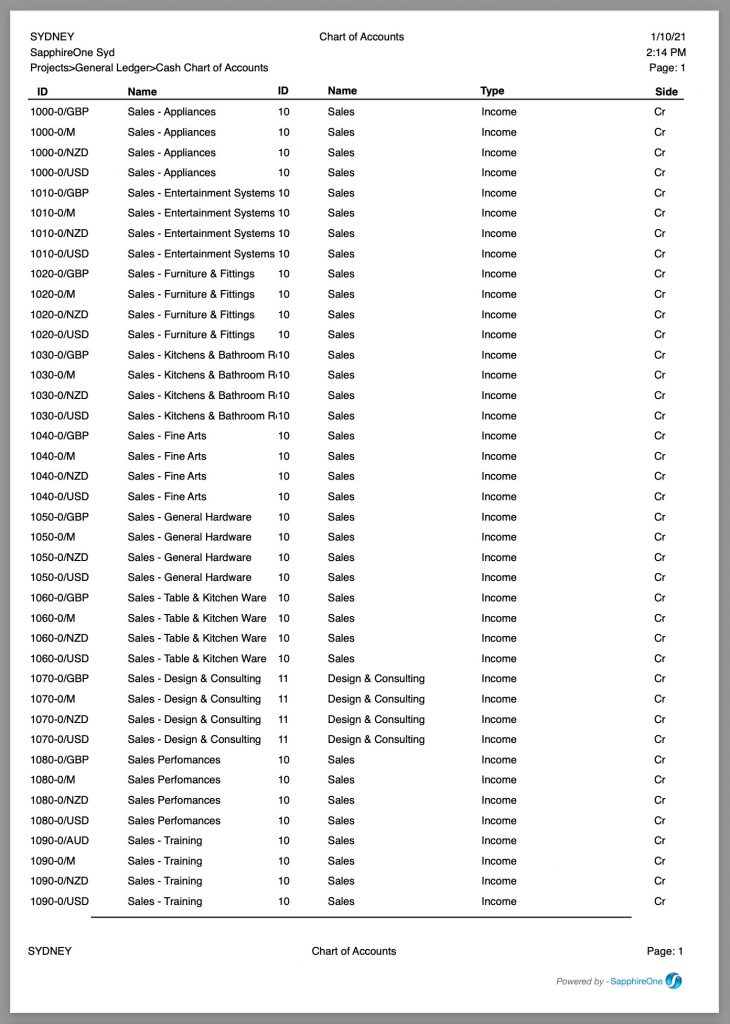
Report Examples (FX Chart of Accounts)
Below is an example of a report that has been created using the default settings of a Report Type of ‘Account ID’. The Report Sort Order was also sorted by ‘Account ID’.
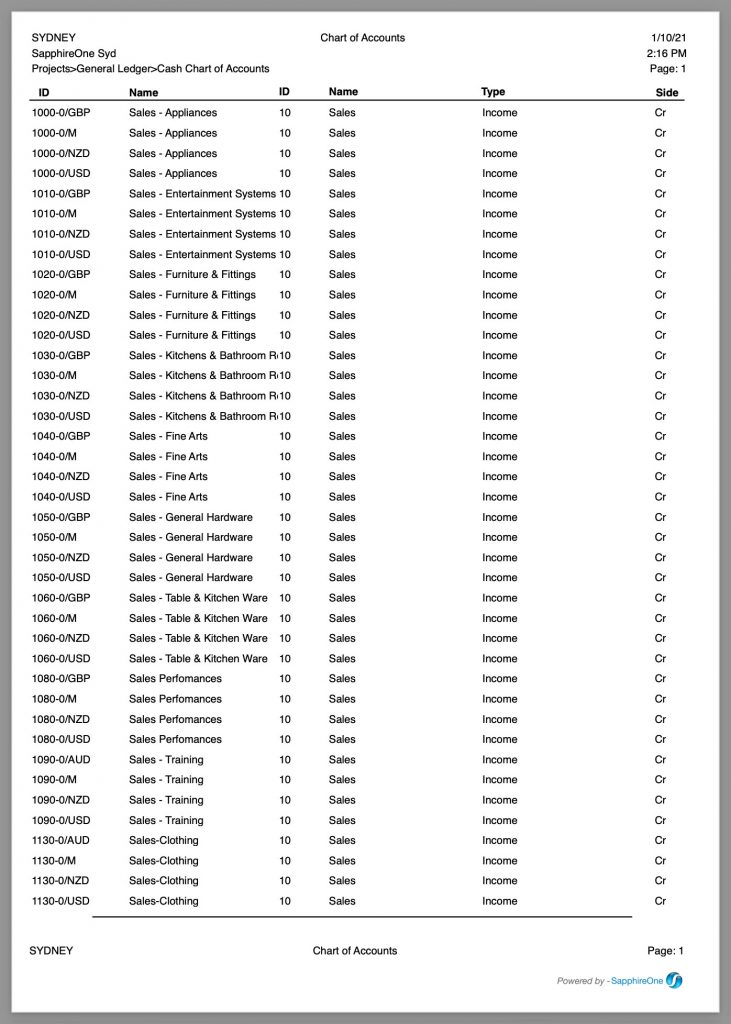
For the second report, we used a Report Type of Account ID, however for the Report Sort Order we used‘Class.
If the default setup mentioned above does not meet the user’s requirements, they have the option to make desired alterations. The foundational structure for the report is already in place, and by making alterations or additions, users can create their own custom report tailored to their specific needs.
You can review our Blog and YouTube channel for additional information and resources on SapphireOne ERP, CRM and Business Accounting software.